

Resumen
El conector MCP de Claude para Sprucely.io es una capa de entrega para los análisis de Claude: permite que Claude convierta los datos de una conversación en un dashboard interactivo, alojado y persistente — uno que tus clientes, directivos o tu equipo pueden abrir desde un enlace o un correo electrónico, sin cuenta de Claude y sin iniciar sesión en Sprucely.io. Lo que aprenderás en esta guía detallada:
- Conectar Claude al servidor MCP de Sprucely.io — desde la app de Claude como conector personalizado, con una clave de API de MCP, o desde Claude Code.
- Crear un dashboard interactivo a partir de los datos de una conversación con una simple petición — Claude elige los tipos de gráfico, el diseño y los títulos, y te devuelve un enlace al panel terminado.
- Elegir con criterio entre una fuente online vinculada que siempre está actualizada y los datos de la conversación, que crecen cuando Claude añade filas — incluso desde agentes programados de Claude.
- Compartir el panel por enlace o correo electrónico, o integrarlo en sitios web y presentaciones de PowerPoint — sin necesidad de cuenta para quienes lo consulten.
Esta guía se centra específicamente en el conector de Claude. Para conocer el resto de integraciones disponibles, consulta nuestra página de conectores.
Ver el vídeo
Los paneles creados mediante el conector son paneles de Sprucely.io como cualquier otro. Este vídeo ofrece una introducción rápida a Sprucely.io y al tipo de dashboard interactivo que Claude crea en tu cuenta. A continuación del vídeo encontrarás las instrucciones detalladas.
Introducción a Sprucely.io y a cómo se crea y comparte un dashboard interactivo (1:25 min.)
Qué hace el conector MCP de Claude
MCP (Model Context Protocol) es el estándar abierto que Claude utiliza para trabajar con herramientas externas, y Sprucely.io ofrece un servidor MCP alojado para él — uno de los pocos servidores MCP de Claude diseñados para entregar resultados a personas ajenas a Claude. En la práctica, esto convierte a Claude en un agente de IA para análisis de datos plenamente capaz: el agente hace el análisis, y Sprucely.io aloja y entrega el resultado. Una vez conectado como conector personalizado, Claude puede llamar directamente a Sprucely.io desde una conversación para:
Crear un dashboard a partir de los datos de la conversación — Claude elige los tipos de gráfico, el diseño y los títulos, y devuelve un enlace que muestra el panel terminado. Sin SQL, sin trabajo de diseño, sin infraestructura que configurar.
Consultar los paneles que ya existen en tu cuenta y obtener sus detalles.
Añadir filas nuevas al conjunto de datos de un panel existente, de modo que el panel pueda crecer con el tiempo — incluso desde agentes programados de Claude que se ejecutan mientras estás lejos del teclado.
La diferencia respecto a un gráfico dentro de la conversación está en la persistencia y el alcance. Un gráfico o artifact pertenece al chat en el que se creó; un panel creado mediante el conector vive fuera de ese chat — alojado en una URL estable, persistente entre sesiones, y compartible con personas que no tienen cuenta de Claude. Verlo tampoco consume nada de tu uso de Claude: analizas una vez en Claude, y cualquier número de interesados puede abrir el resultado.
Los paneles creados mediante el conector son paneles de Sprucely.io como cualquier otro. Aparecen en tu cuenta junto a cualquier panel que hayas creado mediante el flujo de datos a panel, y puedes editarlos, cambiarles el estilo, compartirlos e integrarlos exactamente igual que cualquier panel creado a mano.
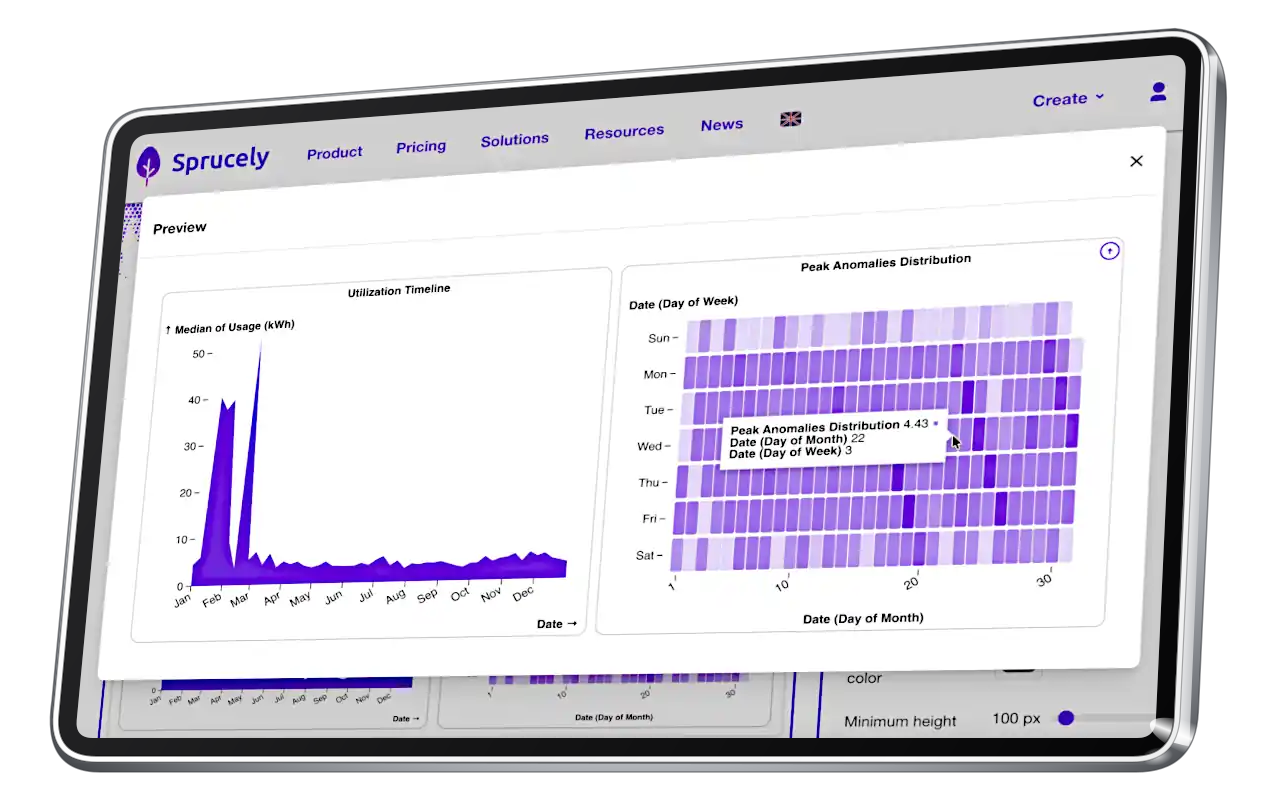
Los paneles creados desde Claude están alojados y son persistentes — sobreviven a la conversación y siguen siendo interactivos en cualquier dispositivo.
Configuración de Claude MCP: Conexión con Sprucely.io
El endpoint del conector es https://www.sprucely.io/mcp. Para añadir MCP a Claude, pega esa URL como conector personalizado — hay dos formas de autenticarte: iniciar sesión con tu cuenta de Sprucely.io, o usar una clave de API de MCP. El mismo servidor MCP funciona en Claude en la web, en la app de escritorio de Claude y en Claude Code.
O, aún más fácil, busca Sprucely.io entre los conectores de Claude que aparecen en el directorio público de Claude e instálalo directamente desde ahí, sin necesidad de escribir ninguna URL.
Inicia sesión con tu cuenta de Sprucely.io (recomendado)
Instrucciones:
- Paso 1: Abre la configuración de conectores - En Claude (web o escritorio), abre Configuración Conectores y elige Añadir conector personalizado.
- Paso 2: Pega el endpoint - Introduce https://www.sprucely.io/mcp como la URL del conector y confirma.
- Paso 3: Inicia sesión en Sprucely.io - Claude abre una página de inicio de sesión de Sprucely.io. Inicia sesión con tu cuenta existente — o, si no tienes una, créala directamente en ese mismo paso. Esta vía funciona en el plan gratuito.
- Paso 4: Ya está todo listo - La conexión se completa, y el primer panel que le pidas a Claude que cree aparece de inmediato en tu cuenta.
Usa una clave de API de MCP
En cualquier plan puedes generar claves de API de larga duración desde tu página de perfil (Perfil AI Model Context Protocol (MCP)). Una clave se muestra una sola vez al crearla y puede revocarse en cualquier momento, y no hay límite de cuántas puedes crear. Las claves son ideales para configuraciones sin interfaz gráfica en las que iniciar sesión desde un navegador no resulta práctico — por ejemplo, un agente que se ejecuta en un servidor.
Claude Code
Los desarrolladores que usan Claude Code pueden añadir Sprucely.io a sus servidores Claude Code MCP desde la terminal:
claude mcp add --transport http sprucely https://www.sprucely.io/mcp
Autentícate cuando se te solicite, y las mismas herramientas de paneles quedarán disponibles en tus sesiones de Claude Code. Entre los mejores servidores MCP para Claude Code, la diferencia práctica aquí está en dónde aterriza el resultado: como un dashboard alojado y compartible, en lugar de texto en la terminal.
Dos maneras de alimentar un panel
Sprucely.io admite dos modelos de datos en total, pero hoy solo uno de ellos está disponible a través de Claude — conviene entenderlo antes de decidir cómo configurar un panel:
Datos enviados por Claude (lo que usa el conector) - Cuando Claude envía filas a través del conector, Sprucely.io las almacena como un conjunto de datos en el almacenamiento de archivos de tu cuenta. El panel muestra ese conjunto de datos almacenado — queda fijo en el momento en que se creó, y solo cambia cuando una llamada posterior del conector añade más filas. Nada se actualiza por sí solo.
Fuente online vinculada (solo en el editor de Sprucely.io, no disponible mediante Claude) - Un panel definido a partir de una URL de fuente de datos (por ejemplo, una hoja de cálculo publicada o un feed de datos, opcionalmente acotado a un rango o a un conjunto de columnas) se vuelve a consultar cada vez que alguien lo abre, por lo que siempre está actualizado sin que nadie tenga que hacer nada más. Esto ya existe hoy en Sprucely.io, pero solo configurándolo tú mismo directamente en el editor — crear un panel de fuente vinculada desde una conversación con Claude está en la hoja de ruta del conector, pero aún no está disponible.
En resumen: todos los paneles que Claude crea hoy usan el primer modelo — se envían los datos en el momento en que se generan en la propia conversación, y tu agente de Claude añade filas nuevas según la periodicidad que le indiques. Si en cambio quieres un panel que refleje siempre una URL en vivo sin ninguna llamada de añadido, configúralo directamente en el editor de Sprucely.io.
Crear un panel a partir de una conversación
Una vez conectado, crear un dashboard es una simple petición: sin configurar gráficos y sin lenguaje de consulta. Adjunte su hoja de cálculo a la conversación y describa lo que quiere ver, incluido el aspecto:
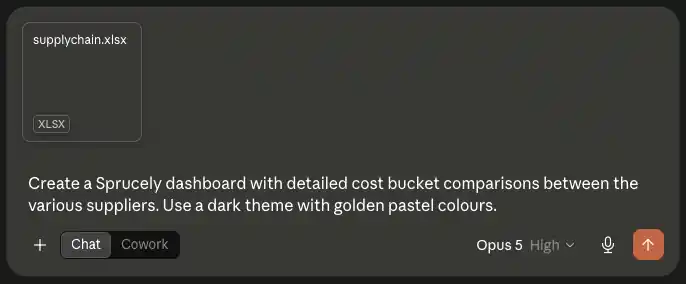
Claude lee el archivo, estructura el conjunto de datos, elige las columnas de cada gráfico y llama al conector. Responde con un enlace al dashboard terminado y un breve resumen de cómo ha transformado los datos.
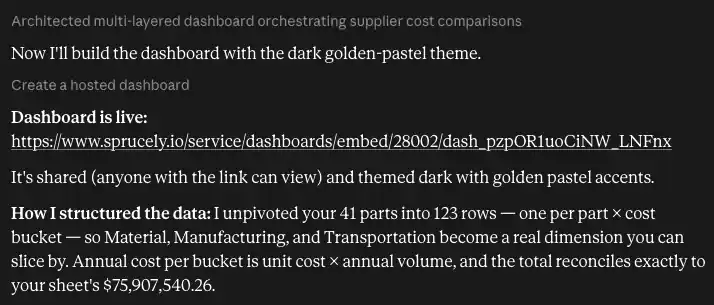
Merece la pena leer esa explicación en lugar de saltársela. En este ejemplo Claude despivotó 41 piezas en 123 filas —una por pieza y partida de coste— de modo que Material, Fabricación y Transporte pasan a ser una dimensión por la que los gráficos pueden filtrar de verdad. Esa es la diferencia entre un dashboard que se puede explorar y la foto de una tabla resumen: el conector necesita registros en bruto, fila a fila, y un buen asistente reorganiza la hoja para producirlos en lugar de enviar totales.
Al abrir el enlace aparece el dashboard generado, con el tema solicitado y compartido para que cualquiera con la URL pueda verlo.
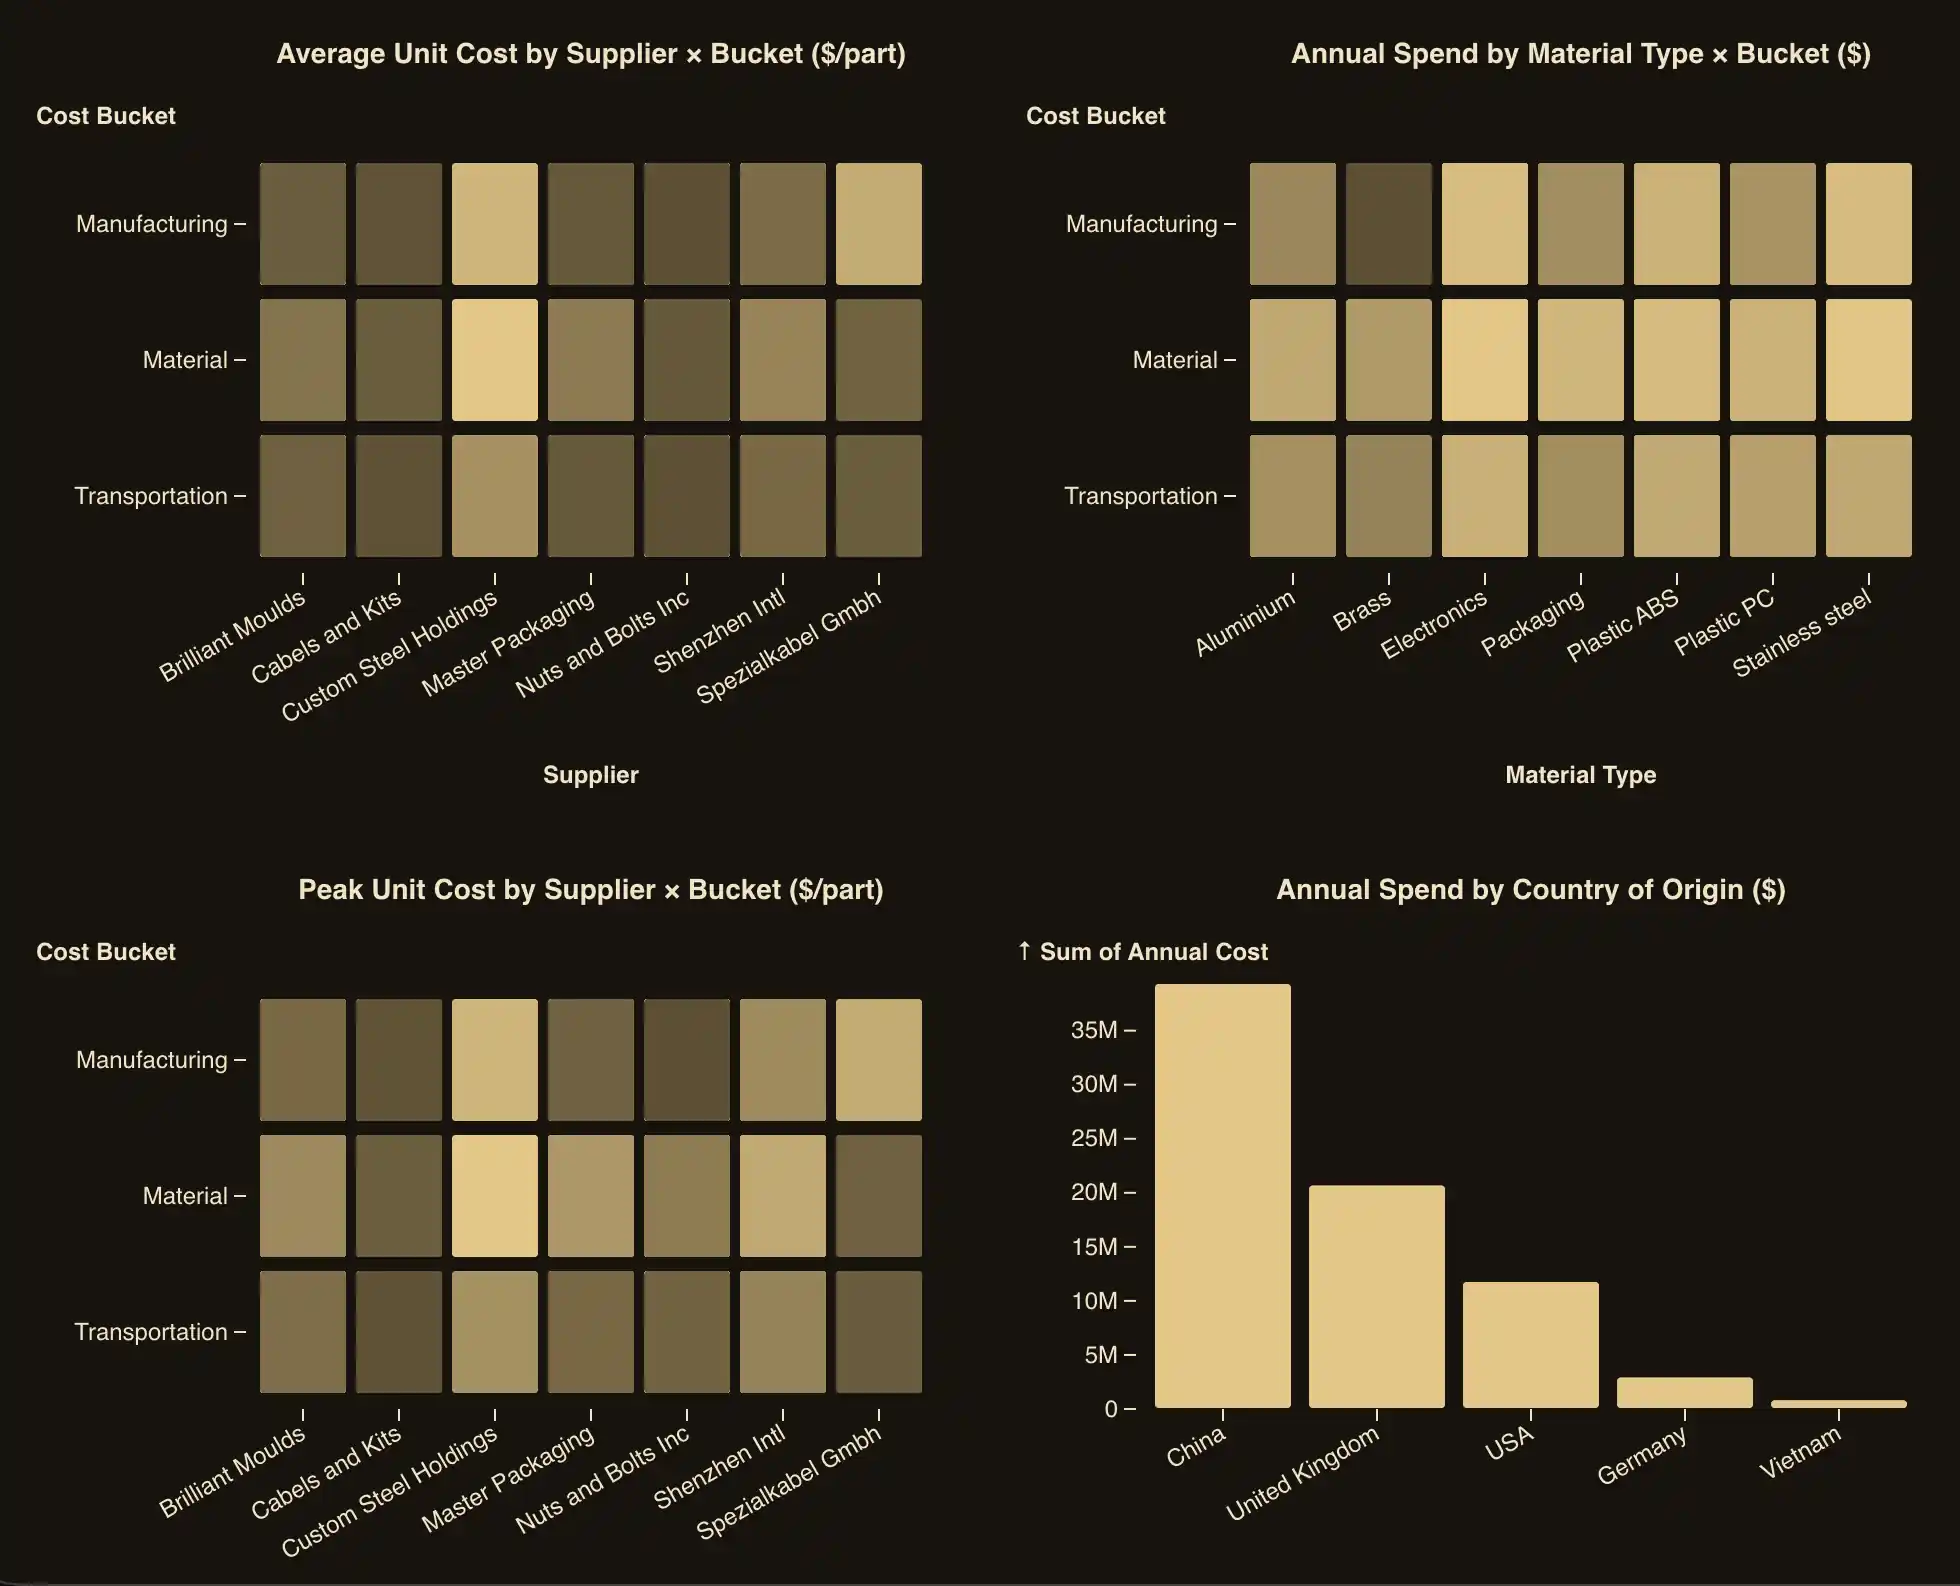
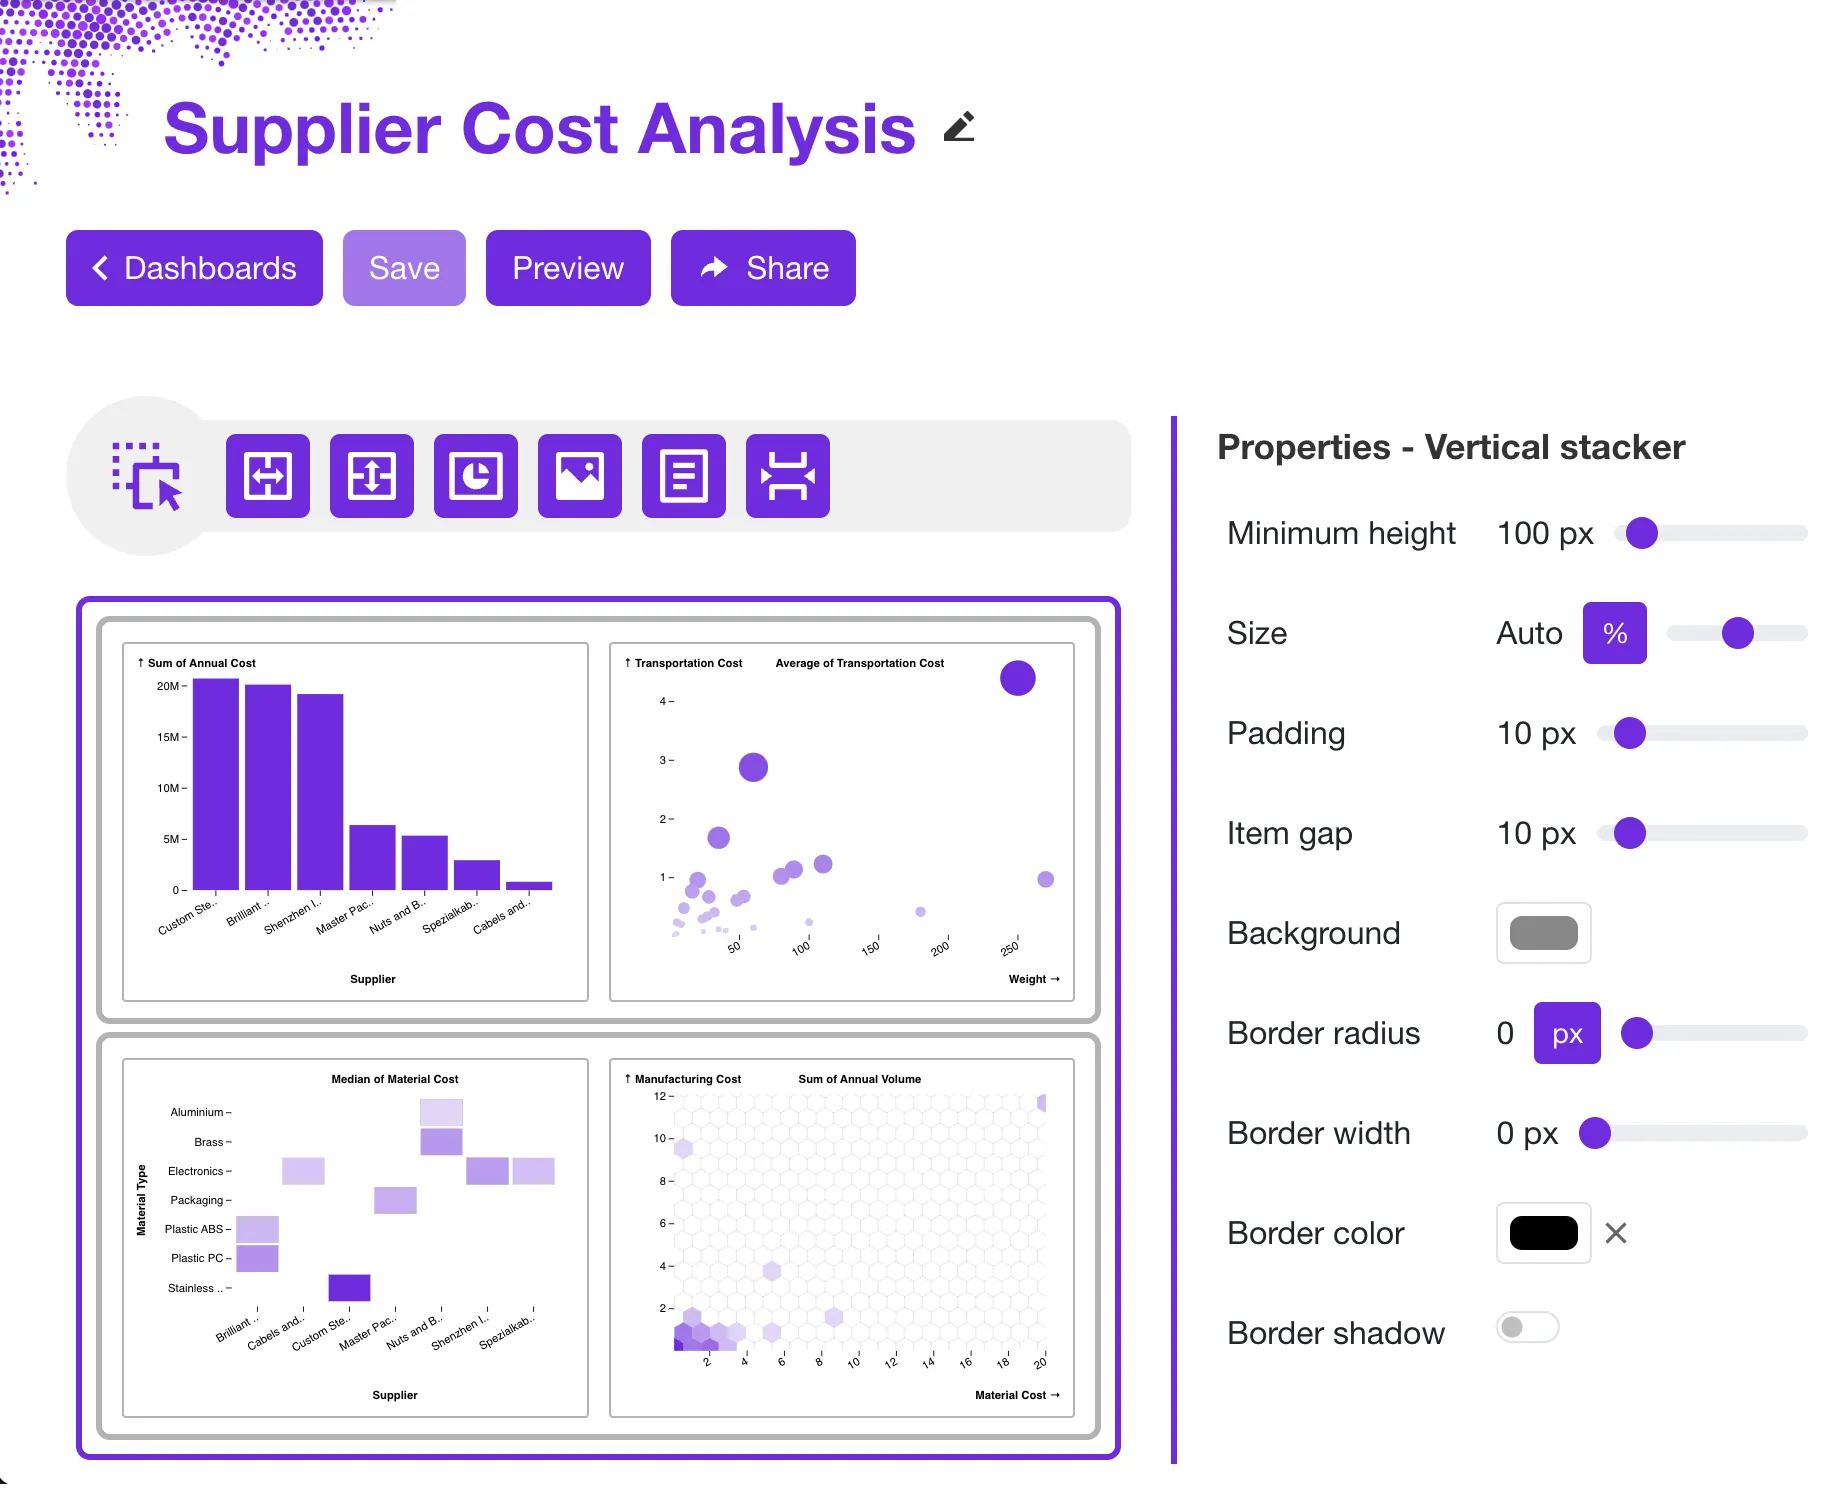
Claude estructura el conjunto de datos, elige las columnas para cada gráfico y llama al conector. Recibes de vuelta un enlace al panel interactivo ya generado. Hay disponibles seis tipos de gráfico — bar, line, area, dot (diagrama de dispersión), cell (mapa de calor) y hexbin — con opciones de agregación (suma, promedio, conteo, mediana, mínimo, máximo, desviación estándar) y agrupación temporal para columnas de fecha. Los paneles pueden combinar muchos gráficos y widgets, y un conjunto de datos admite millones de registros en los planes de pago.
Una sola llamada admite hasta 50.000 filas; para conjuntos de datos más grandes, Claude envía un lote inicial y añade el resto automáticamente en llamadas posteriores.
Después de crearlo, puedes perfeccionar el resultado en el editor de Sprucely.io como cualquier otro panel: reorganiza el diseño con arrastrar y soltar, aplica uno de los temas de color predefinidos o tu propia paleta, y reconfigura cada gráfico individualmente con el asistente de gráficos.
Ampliar un panel ejecución tras ejecución
La capacidad de añadir filas es lo que convierte un gráfico puntual en un registro vivo — el patrón de “seguir esto cada semana”. Como una conversación posterior — o un agente programado de Claude — puede añadir filas a un panel creado anteriormente, puedes seguir una rutina semanal como esta:
Semana 1 - “Analiza la exportación del pipeline de esta semana y crea un panel de Sprucely que siga los totales por etapa.” Claude crea el panel; tú compartes el enlace una vez.
Cada semana siguiente - “Analiza la exportación de esta semana y añade los resultados al panel del pipeline.” Claude añade las filas nuevas; el mismo enlace ahora muestra un historial más largo.
Si usas los agentes programados de Claude, el paso semanal se ejecuta sin que tengas que intervenir: el agente realiza el análisis y añade las filas nuevas en cada ejecución, y la audiencia del panel sigue abriendo la misma URL. El panel se actualiza cuando — y solo cuando — una ejecución del agente escribe en él, así que la periodicidad de tu agente marca la periodicidad de tu informe.
Este patrón encaja con cualquier informe interactivo recurrente: informes semanales para clientes, revisiones del pipeline de ventas, tendencias de tickets de soporte, resultados de campañas de marketing o KPIs operativos. El análisis ocurre en Claude; el registro se acumula en Sprucely.io.
Casos de uso: agentes de IA para análisis de datos
Los agentes de IA para análisis de datos necesitan un lugar donde entregar sus resultados, y los mismos dos bloques básicos — crear un panel y luego añadirle datos ejecución tras ejecución — cubren la mayoría de los informes recurrentes. Algunos patrones concretos:
Registro vivo de KPIs para un agente programado de Claude. Los responsables de operaciones y finanzas que ya ejecutan una Claude Routine, un Managed Agent o una tarea de Cowork con periodicidad semanal le dan a ese agente una instrucción más: añadir las cifras de cada ejecución a un panel de Sprucely en lugar de dejar que se pierdan en la sesión. El panel se convierte en el registro canónico de cada ejecución, y el chequeo del lunes pasa a ser “abrir el enlace”, no “volver a ejecutar el análisis”.
“Cada lunes, extrae las cifras de ingresos y pipeline de la semana pasada y añádelas al panel de KPIs Semanales.”
Informes para clientes de consultores, CFOs a tiempo parcial y pequeñas agencias. En lugar de rehacer una presentación cada mes, pide a Claude que cree el panel del cliente una sola vez y añada cifras nuevas en cada entrega. Como el panel es un panel de Sprucely.io de pleno derecho, compartirlo — por enlace, por correo electrónico o integrado en un informe — se hace desde tu cuenta cuando tú decidas que el cliente debe ver la actualización; Claude se encarga del análisis, no del envío.
“Analiza los datos del cliente de este mes y añádelos al panel de informes de Acme Corp.”
Revisiones del pipeline de ventas y de operaciones comerciales. Los equipos de ingresos hacen seguimiento de los totales del pipeline por etapa a lo largo del tiempo haciendo que Claude analice una exportación del CRM y añada los datos a un panel del pipeline después de cada sincronización, convirtiendo una fotografía puntual en una tendencia que todo el equipo puede consultar.
“Analiza la exportación del pipeline de esta semana y añade los totales por etapa al panel de Revisión del Pipeline.”
Seguimiento de tendencias de soporte y operaciones. Los responsables de soporte y operaciones usan el mismo patrón para el volumen de tickets, los tiempos de respuesta o el cumplimiento de SLA — un panel continuo que crece con cada exportación, sin una hoja de cálculo que mantener a mano.
“Resume los tickets de soporte de esta semana por categoría y añade los recuentos al panel de Tendencias de Soporte.”
Rendimiento de campañas de marketing. Los profesionales de marketing y las agencias añaden los resultados de la campaña después de cada ciclo de informes — inversión, conversiones y rendimiento por canal — para que los interesados vean la evolución completa de la campaña, no solo la última instantánea.
“Analiza los datos de rendimiento de esta campaña y añádelos al panel de Campañas del Q3.”
Lo que todos estos casos tienen en común: el panel interactivo y la herramienta para añadir filas ya existen y funcionan hoy. La recurrencia viene de tu propia periodicidad — un agente programado de Claude, o simplemente volver a pedirlo la semana siguiente — no de nada que Sprucely.io programe en tu nombre.
Compartir e integrar su panel
Pide a Claude que comparta el panel y te devolverá un enlace de visualización que puedes enviar directamente a un cliente o colega. Cualquiera que tenga el enlace del panel puede abrirlo en un navegador — sin necesidad de cuenta, sin inicio de sesión, en cualquier dispositivo. Quienes lo consulten obtienen la experiencia interactiva completa, incluido el filtrado cruzado en gráficos multidimensionales.
Desde tu cuenta de Sprucely.io también puedes enviar un panel por correo electrónico directamente a los destinatarios, y desactivar el uso compartido de nuevo en cualquier momento. Encontrarás instrucciones paso a paso para compartir en nuestra guía de Excel a dashboard.
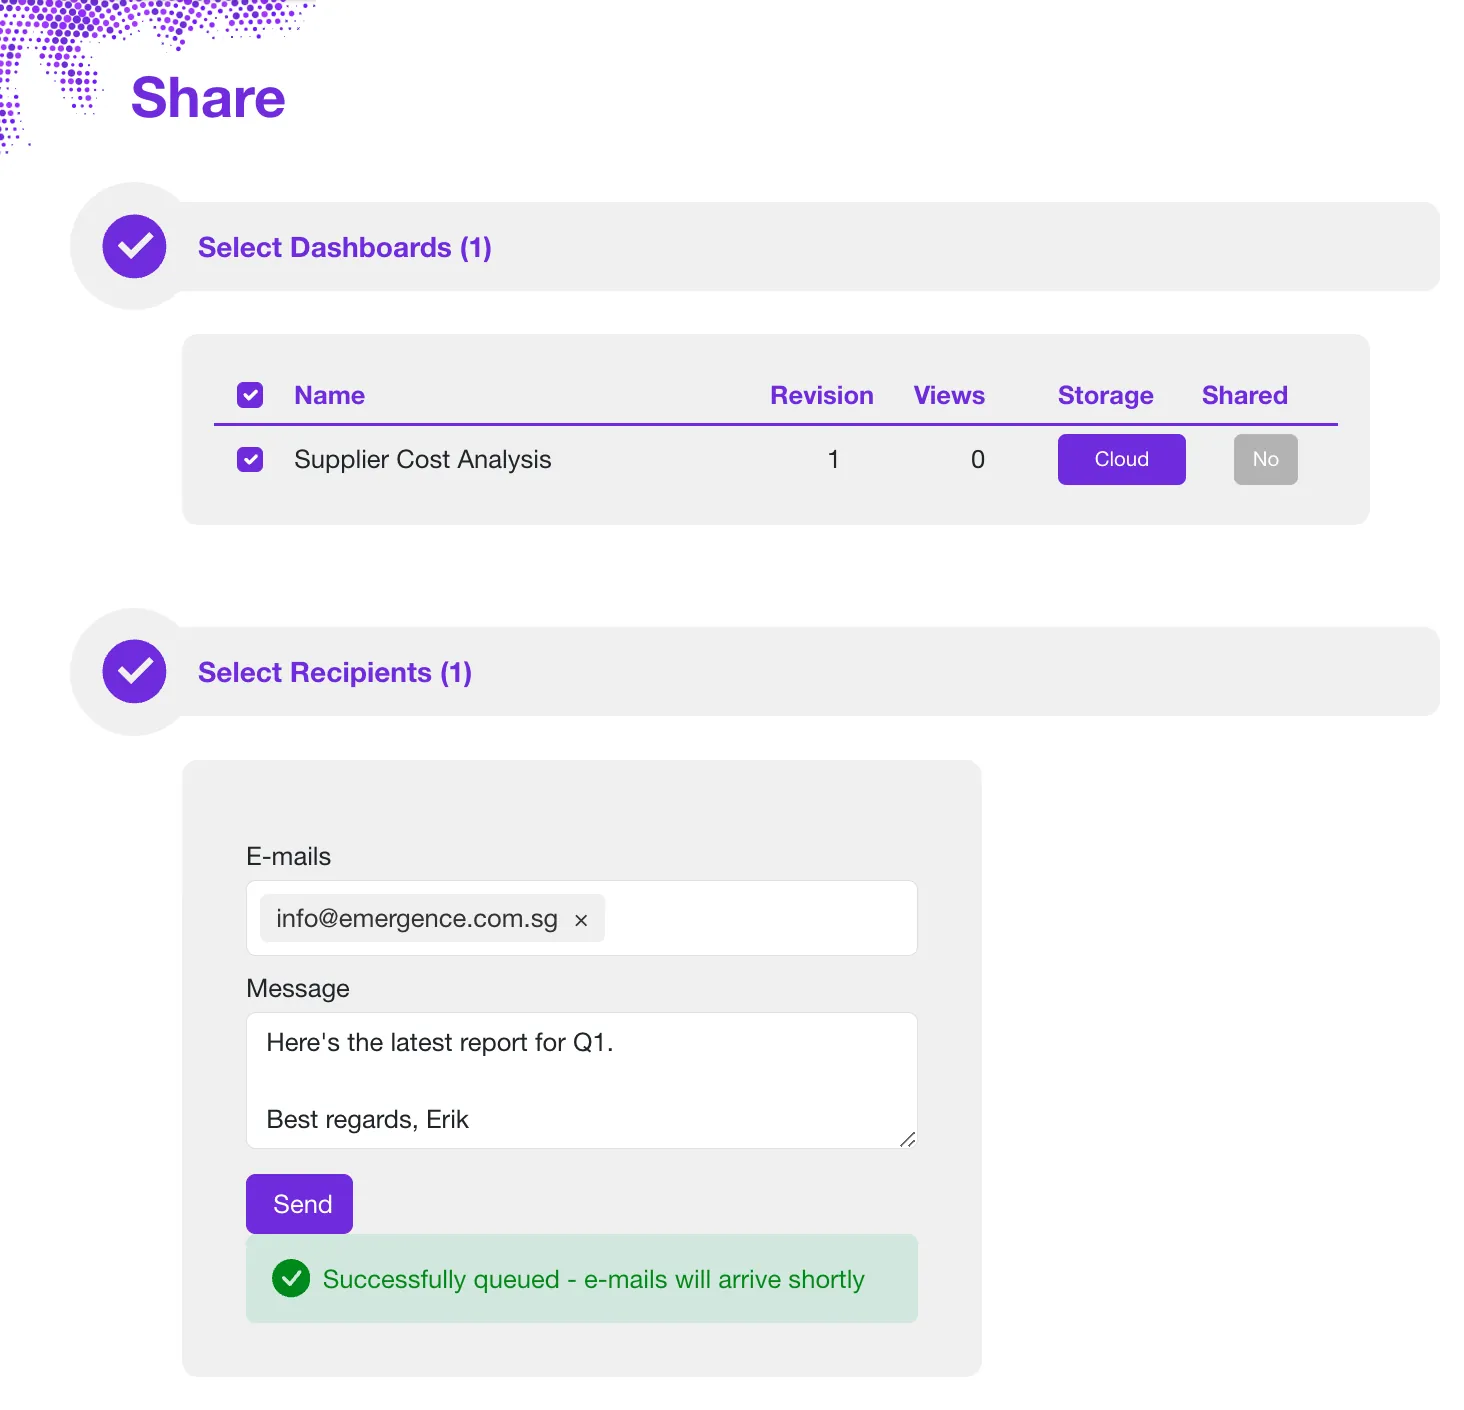
Más allá de los enlaces, los paneles se integran allí donde tu audiencia ya trabaja: en un sitio web de cara al cliente mediante iframe, en presentaciones de PowerPoint, y en Google Docs y Slides a través de los complementos que aparecen en nuestra página de conectores.
Planes y límites
El conector funciona en todos los planes — la función en sí no está restringida por nivel de plan. Lo único que escala con tu plan es el almacenamiento de conjuntos de datos: se mide contra la cuota de tu plan, y el conector indica con claridad el espacio restante si un conjunto de datos fuera a superarla. Puedes generar claves de API de MCP e iniciar sesión con tu cuenta en cualquier plan, incluido el gratuito, sin límite en el número de claves. Consulta precios para conocer las cuotas de almacenamiento actuales y los detalles de cada plan.

Convierte tus datos en inteligencia decisoria en 30 segundos
Registrarse Gratis para empezar. Consulta nuestros planes.
Conclusión
Claude hace el análisis; Sprucely.io lo convierte en un dashboard interactivo y persistente que tus clientes y directivos abren desde un enlace o un correo electrónico — sin cuenta de Claude, sin inicio de sesión, y sin gastar nada de tu uso de Claude en quienes lo consultan. Conecta ambos una vez, y un insight generado en una conversación se convierte en un panel que puedes enviar, integrar y seguir haciendo crecer.
Añade el conector de Sprucely.io en la configuración de Claude con el endpoint https://www.sprucely.io/mcp, o desde Claude Code con claude mcp add. Después, pídele a Claude tu primer panel, perfecciónalo en el editor si quieres, y comparte el enlace.
Si prefieres crear paneles directamente desde tus archivos, nuestra guía de Excel a dashboard cubre el mismo resultado sin necesidad de Claude, y la guía de paneles en PowerPoint muestra cómo presentar el panel terminado en tus diapositivas. Para una visión general de ambas rutas, consulte el generador de dashboards con IA.
Regístrate de forma gratuita en Sprucely.io para empezar. También puedes consultar primero nuestra guía de introducción o comparar los planes de suscripción.
Este artículo fue publicado por primera vez el 28 de julio de 2026.
Sobre el autor

Erik Unemyr
Fundador de Emergence Software y líder de la plataforma Sprucely.io
Preguntas frecuentes
¿Cómo conecto Claude o Claude Code al servidor MCP de Sprucely.io?
En Claude (web o app de escritorio), ve a Configuración, luego a Conectores, elige Añadir conector personalizado y pega https://www.sprucely.io/mcp — o busca Sprucely.io en el directorio público de conectores e instálalo directamente desde ahí. Claude abre una página de inicio de sesión de Sprucely.io donde inicias sesión o creas una cuenta gratuita. En Claude Code, ejecuta claude mcp add --transport http sprucely https://www.sprucely.io/mcp y autentícate cuando se te solicite.
¿Qué son los conectores de Claude?
Los conectores de Claude son complementos, listados en el directorio público de conectores de Claude o añadidos mediante una URL como conector personalizado, que permiten a Claude llamar directamente a un servicio externo desde una conversación. El conector de Sprucely.io es uno de ellos: una vez añadido, Claude puede crear, consultar y ampliar paneles interactivos sin que tengas que salir del chat.
¿A qué datos puede acceder Claude a través de los conectores?
Solo a lo que el conector expone. El conector de Sprucely.io permite a Claude crear paneles, consultar los que ya existen en tu cuenta y añadir filas al conjunto de datos de un panel — no tiene acceso a tus archivos, tu correo electrónico ni a los datos de ningún otro conector de Claude. El propio Sprucely.io solo almacena lo que Claude le envía para construir el panel.
¿En qué se diferencia un panel de Sprucely.io de un gráfico en la conversación de Claude?
La persistencia y el alcance. Un gráfico en una conversación pertenece a esa conversación; un panel creado mediante el conector MCP está alojado en una URL estable, persiste entre sesiones, puede recibir filas nuevas en ejecuciones posteriores, y se abre para personas sin cuenta de Claude — sin consumir nada de tu uso de Claude.
¿Las personas con las que comparto un panel necesitan una cuenta de Claude o de Sprucely.io?
No. Cualquiera que tenga el enlace de visualización puede abrir el panel interactivo en un navegador — sin cuenta de Claude, sin inicio de sesión en Sprucely.io, sin instalar software, en cualquier dispositivo. También puedes enviar el panel por correo electrónico desde tu cuenta, y desactivar el uso compartido de nuevo en cualquier momento.
¿Qué tipos de gráfico y qué límites de conjuntos de datos admite el conector?
Seis tipos de gráfico — bar, line, area, dot (diagrama de dispersión), cell (mapa de calor) y hexbin — con opciones de agregación (suma, promedio, conteo, mediana, mínimo, máximo, desviación estándar) y agrupación temporal para columnas de fecha.un conjunto de datos admite millones de registros en los planes de pago, y una sola llamada admite hasta 50.000 filas; Claude añade los conjuntos de datos más grandes en llamadas posteriores automáticamente.
¿Puede un panel actualizarse por sí solo después de crearse?
No por sí solo. Un panel que crea Claude queda fijo en el momento en que se creó — solo cambia cuando una llamada posterior del conector añade filas nuevas, que es exactamente lo que puede hacer un agente programado de Claude ejecución tras ejecución, manteniendo actualizado el mismo enlace compartido. Por separado, el editor de Sprucely.io permite vincular un panel a una URL que se vuelve a consultar en cada visualización, pero eso se configura directamente en el editor, no a través de Claude.
¿Funciona el conector MCP en el plan gratuito?
Sí. El conector funciona en todos los planes sin restricción por nivel de plan; solo el almacenamiento de conjuntos de datos se mide contra la cuota de tu plan. Puedes iniciar sesión con tu cuenta o generar un número ilimitado de claves de API de MCP en cualquier plan, incluido el gratuito. Consulta la página de precios para conocer las cuotas de almacenamiento.
¿Puede Claude enviar el panel a mi cliente automáticamente?
Hoy no, directamente desde Claude. Claude crea y hace crecer el panel; enviarlo — por enlace o por correo electrónico — se hace desde tu cuenta de Sprucely.io cuando tú decidas, de modo que nada llega a un cliente sin que tú lo decidas antes. Es el mismo patrón que se usa para los informes semanales para clientes, las revisiones del pipeline de ventas y otros casos de uso recurrentes.
¿Puedo usar Claude como agente de IA para análisis de datos?
Sí — ese es precisamente el patrón para el que está pensado este conector. Claude realiza el análisis de datos en una conversación o en una ejecución programada, y Sprucely.io le da una herramienta de entrega: el análisis se convierte en un panel interactivo alojado que los revisores humanos abren desde un enlace. Los equipos que ejecutan varios agentes de IA para análisis de datos pueden dar a cada agente su propia clave de API de MCP, de modo que cada agente cree y amplíe paneles en la cuenta correcta.
¿Es Sprucely.io uno de los mejores servidores MCP para Claude Code?
Para flujos de trabajo que necesitan entregar resultados a alguien fuera de la terminal, sí — es uno de los pocos servidores MCP para Claude Code diseñados específicamente para convertir el resultado en un panel alojado y compartible, en lugar de texto en una sesión. Añádelo con claude mcp add --transport http sprucely https://www.sprucely.io/mcp.