

Summary
The Sprucely.io Claude MCP connector is a delivery layer for Claude’s analyses: it lets Claude turn data from a conversation into a hosted, persistent, interactive dashboard — one your clients, executives, or team can open from a link or an email without a Claude account and without a Sprucely.io login. What you will learn in this detailed guide:
- Connect Claude to the Sprucely.io MCP server — from the Claude app as a custom connector, with an MCP API key, or from Claude Code.
- Create an interactive dashboard from conversation data with a plain request — Claude picks the chart types, layout, and titles, and returns a link to the finished dashboard.
- Choose deliberately between a linked online source that is always current and conversation data that grows when Claude appends rows — including from scheduled Claude agents.
- Share the dashboard by link or email, or embed it in websites and PowerPoint presentations — no account required for your viewers.
This guide covers the Claude connector specifically. For the other available integrations, see our connectors page.
Watch the Video
Dashboards created through the connector are regular Sprucely.io dashboards. This video gives a quick introduction to Sprucely.io and the kind of interactive dashboard Claude creates in your account. Detailed instructions follow the video.
Sprucely.io introduction and how an interactive dashboard is created and shared (1:25 mins)
What the Claude MCP Connector Does
MCP (Model Context Protocol) is the open standard Claude uses to work with external tools, and Sprucely.io provides a hosted MCP server for it — one of the few Claude MCP servers built for delivering results to people outside Claude. In practice this makes Claude a capable AI agent for data analysis: the agent does the analysis, and Sprucely.io hosts and delivers the result. Once connected as a custom connector, Claude can call Sprucely.io directly from a conversation to:
Create a dashboard from data in the conversation — Claude picks the chart types, layout, and titles, and returns a link that renders the finished dashboard. No SQL, no design work, no infrastructure to set up.
Look up dashboards already in your account and fetch their details.
Append new rows to an existing dashboard’s dataset, so a dashboard can grow over time — including from scheduled Claude agents that run while you are away from the keyboard.
The difference from a chart inside the conversation is persistence and reach. A chart or artifact belongs to the chat it was made in; a dashboard created through the connector lives outside it — hosted at a stable URL, persistent across sessions, and shareable with people who have no Claude account. Viewing it also consumes none of your Claude usage: you analyze once in Claude, and any number of stakeholders can open the result.
Dashboards created through the connector are regular Sprucely.io dashboards. They appear in your account next to any dashboard you built through the data-to-dashboard flow, and you can edit, restyle, share, and embed them exactly like any dashboard you created by hand.
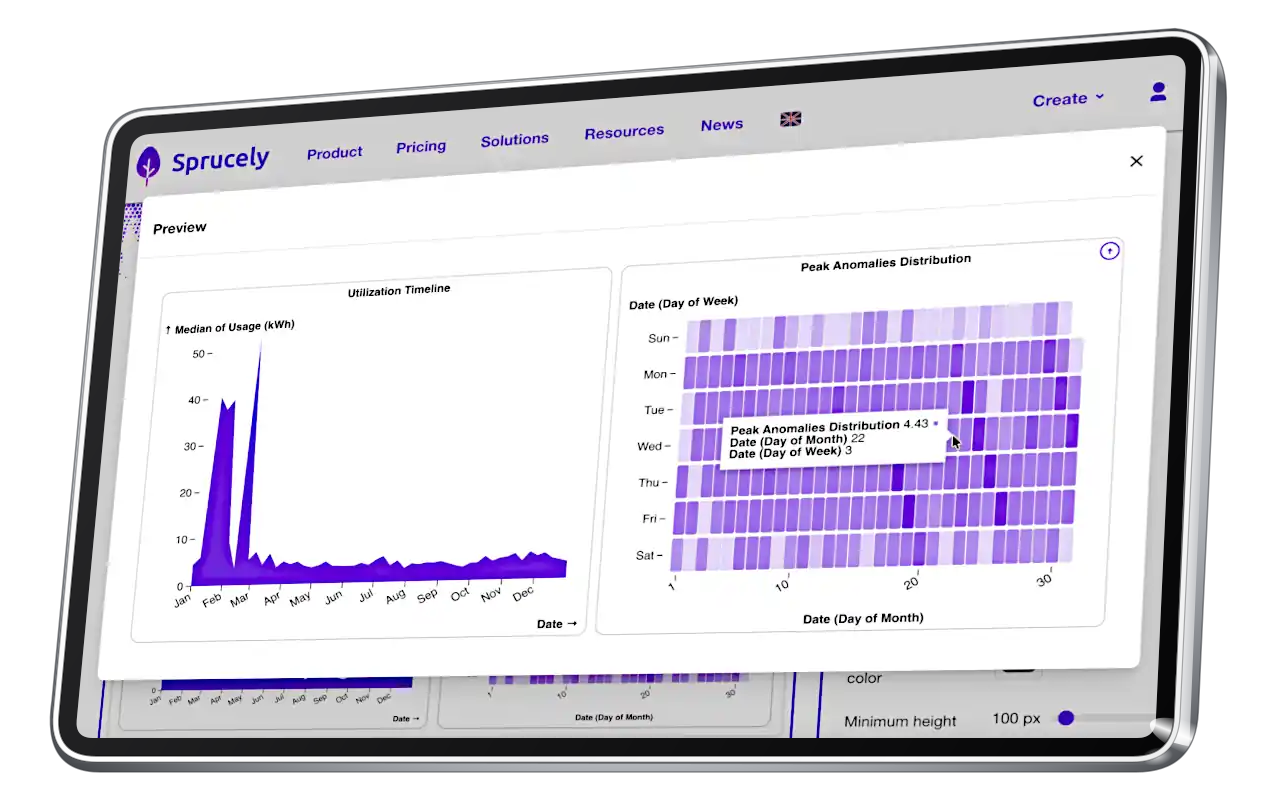
Dashboards created from Claude are hosted and persistent — they outlive the conversation and stay interactive on any device.
Claude MCP Setup: Connecting to Sprucely.io
The connector endpoint is https://www.sprucely.io/mcp. To add MCP to Claude, paste that URL in as a custom connector — there are two ways to authenticate: sign in with your Sprucely.io account, or use an MCP API key. The same MCP server works in Claude on the web, in the Claude desktop app, and in Claude Code.
Or, even easier, search for Sprucely.io among the Claude connectors listed in Claude’s public directory and install it directly from there — no URL to type.
Sign in with your Sprucely.io account (recommended)
Instructions:
- Step 1: Open the connector settings - In Claude (web or desktop), open Settings Connectors and choose Add custom connector.
- Step 2: Paste the endpoint - Enter https://www.sprucely.io/mcp as the connector URL and confirm.
- Step 3: Sign in to Sprucely.io - Claude opens a Sprucely.io sign-in page. Sign in with your existing account — or, if you do not have one, create it right there in the flow. This path works on the free tier.
- Step 4: You are ready to go - The connection completes, and the first dashboard you ask Claude to create shows up in your account immediately.
Use an MCP API key
On any plan you can mint long-lived API keys from your profile page (Profile AI Model Context Protocol (MCP)). A key is shown once at creation and can be revoked at any time, and there is no limit on how many you create. Keys suit headless setups where a browser sign-in is impractical — for example an agent running on a server.
Claude Code
Developers using Claude Code can add Sprucely.io to their Claude Code MCP servers from the terminal:
claude mcp add --transport http sprucely https://www.sprucely.io/mcp
Authenticate when prompted, and the same dashboard tools become available in your Claude Code sessions. Among the best MCP servers for Claude Code, the practical difference here is where the output lands: as a shareable, hosted dashboard rather than terminal text.
Two Ways to Feed a Dashboard
Sprucely.io supports two data models overall, but only one of them is available through Claude today — worth understanding before you decide how to set a dashboard up:
Data sent by Claude (what the connector uses) - When Claude sends rows through the connector, Sprucely.io stores them as a dataset in your account’s file storage. The dashboard renders that stored dataset — it is fixed as of the moment it was created, and it changes only when a later connector call appends more rows. Nothing refreshes on its own.
Linked online source (Sprucely.io editor only, not available via Claude) - A dashboard defined against a data source URL (for example a published spreadsheet or a data feed, optionally narrowed to a range or set of columns) is re-fetched every time someone opens it, so it is always current with no further work from anyone. This exists in Sprucely.io today, but only by configuring it yourself directly in the editor — creating a linked-source dashboard from a Claude conversation is on the connector roadmap, not available yet.
In short: every dashboard Claude creates today uses the first model — send the data when it was produced in the conversation itself, and let your Claude agent append new rows on whatever schedule you give it. If you instead want a dashboard that always reflects a live URL with no append calls at all, set that up directly in the Sprucely.io editor.
Creating a Dashboard from a Conversation
Once connected, dashboard creation is a plain request — no chart configuration and no query language. Attach your spreadsheet to the conversation and describe what you want to see, including the look:
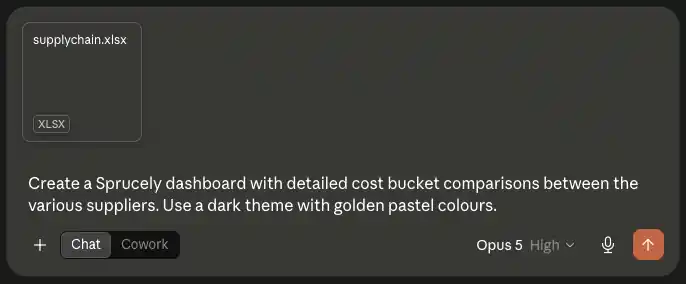
Claude reads the file, structures the dataset, picks the columns for each chart, and calls the connector. It replies with a link to the finished dashboard and a short account of how it shaped the data.
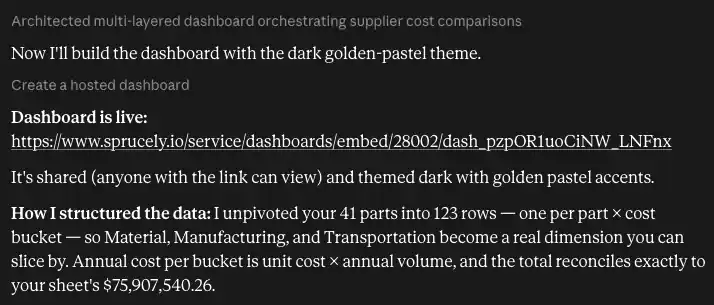
That explanation is worth reading rather than skipping. In this example Claude unpivoted 41 parts into 123 rows — one row per part and cost bucket — so that Material, Manufacturing and Transportation became a dimension the charts can actually slice by. This is the difference between a dashboard you can explore and a picture of a summary table: the connector needs raw, row-level records, and a good assistant will reshape the sheet to produce them rather than sending totals.
Opening the link gives you the rendered dashboard, themed as requested and shared so anyone with the URL can view it.
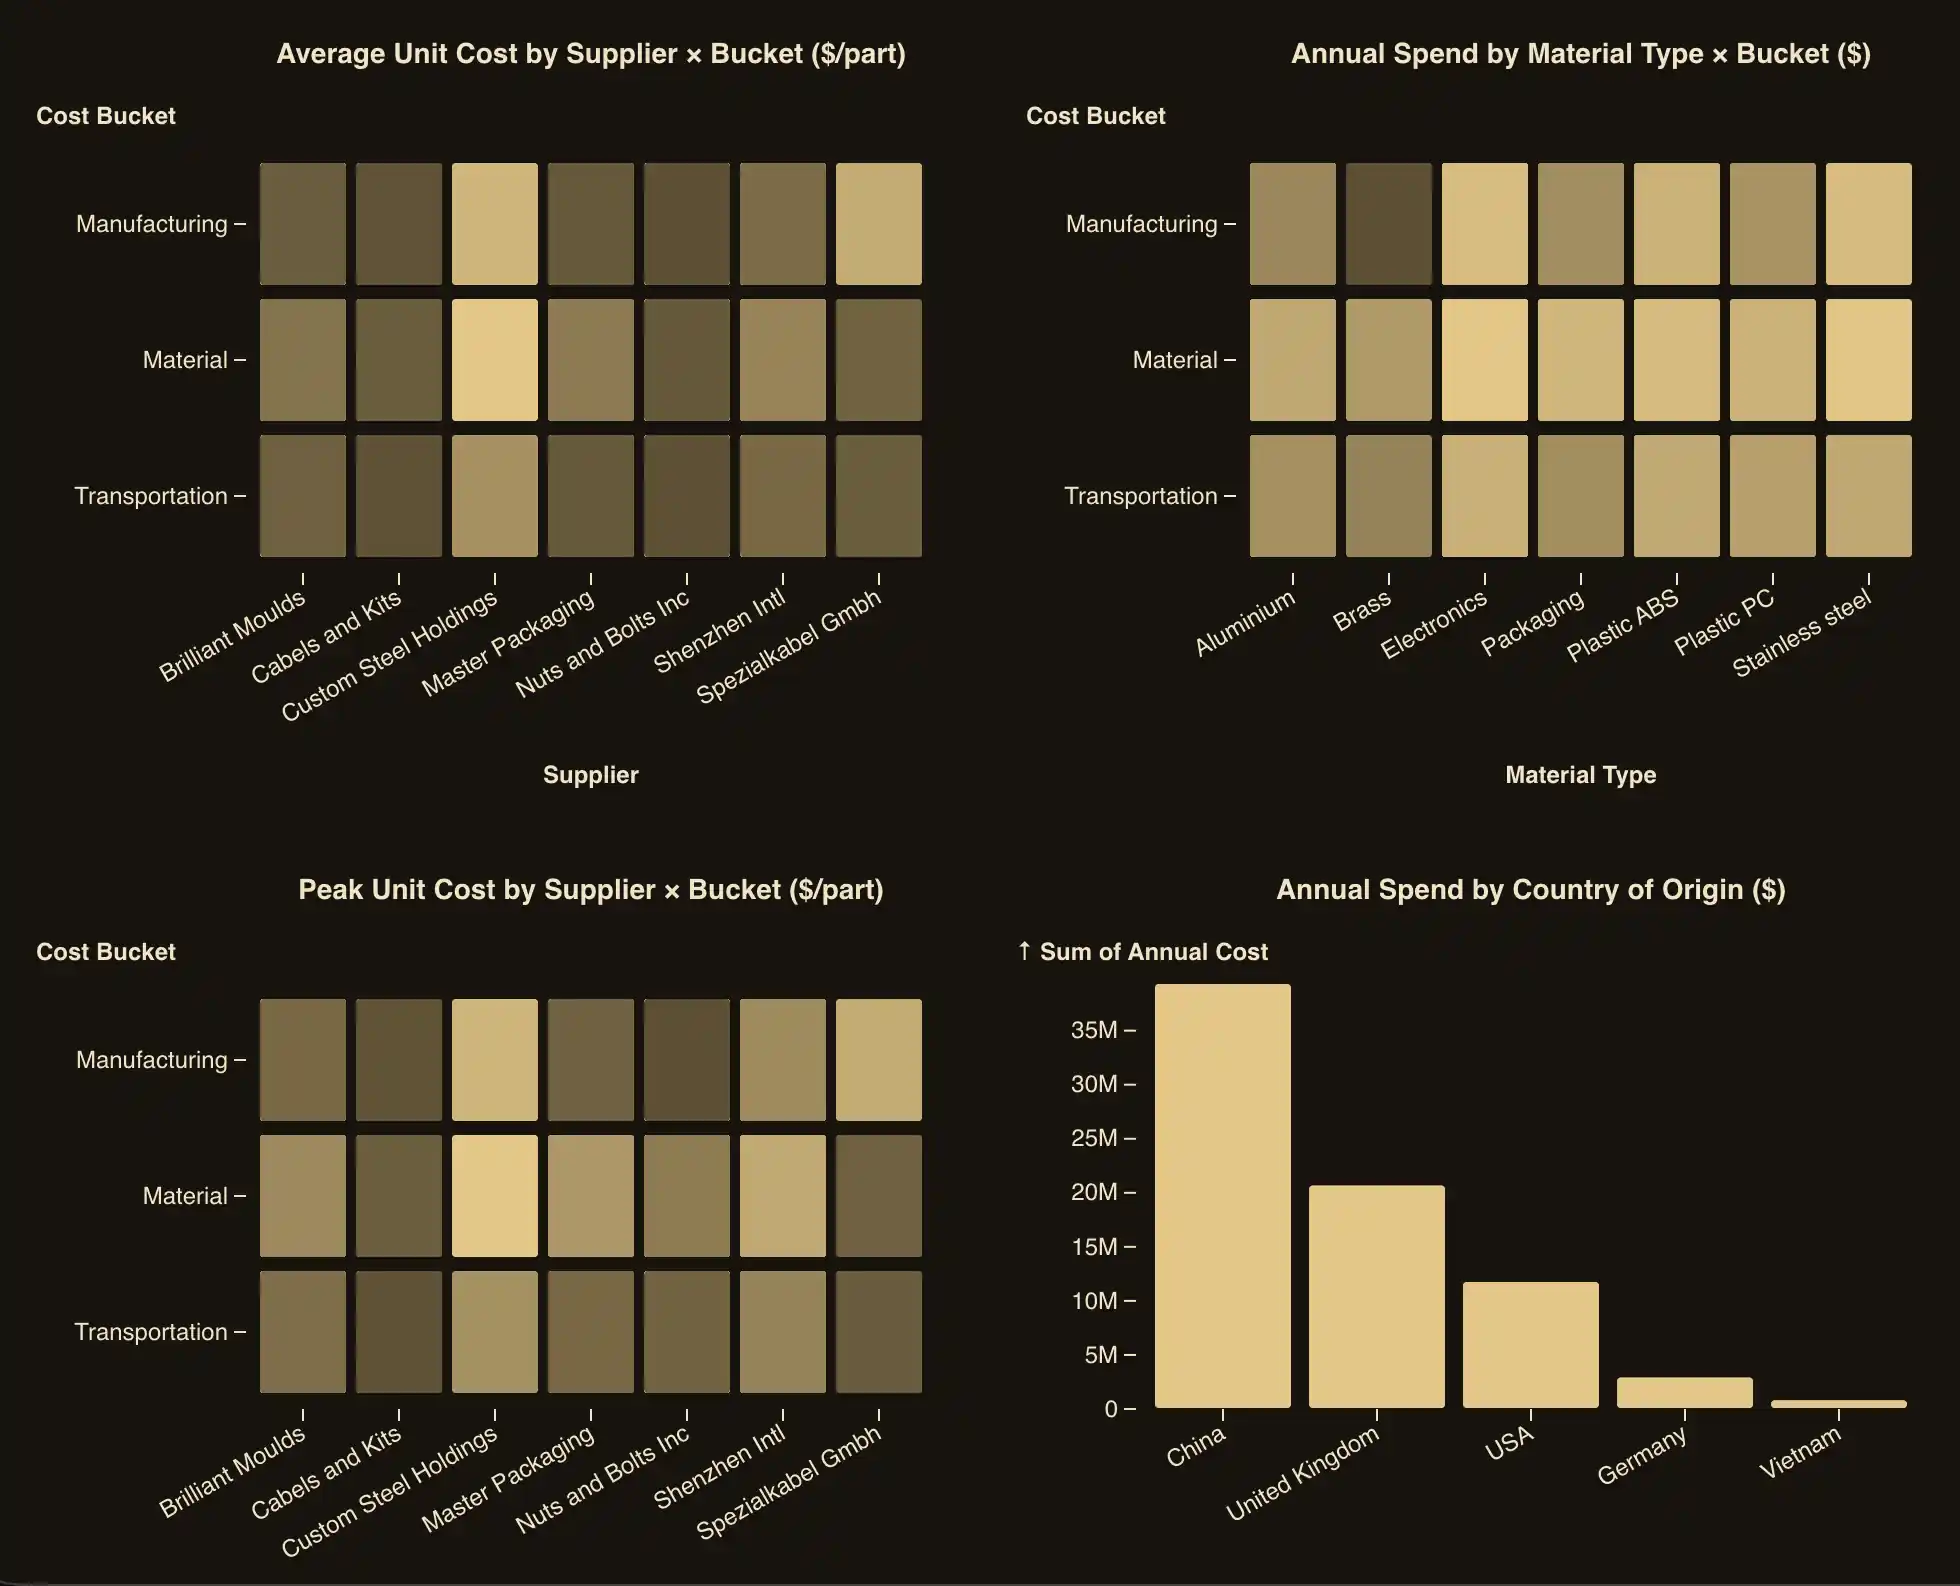
Six chart types are available — bar, line, area, dot (scatter), cell (heatmap), and hexbin — with aggregation (sum, average, count, median, min, max, standard deviation) and time-based grouping for date columns. Dashboards can combine many charts and widgets, and a dataset can support millions of records in paid subscription tiers.
A single call carries up to 50,000 rows; for larger datasets, Claude sends an initial batch and appends the rest in follow-up calls automatically.
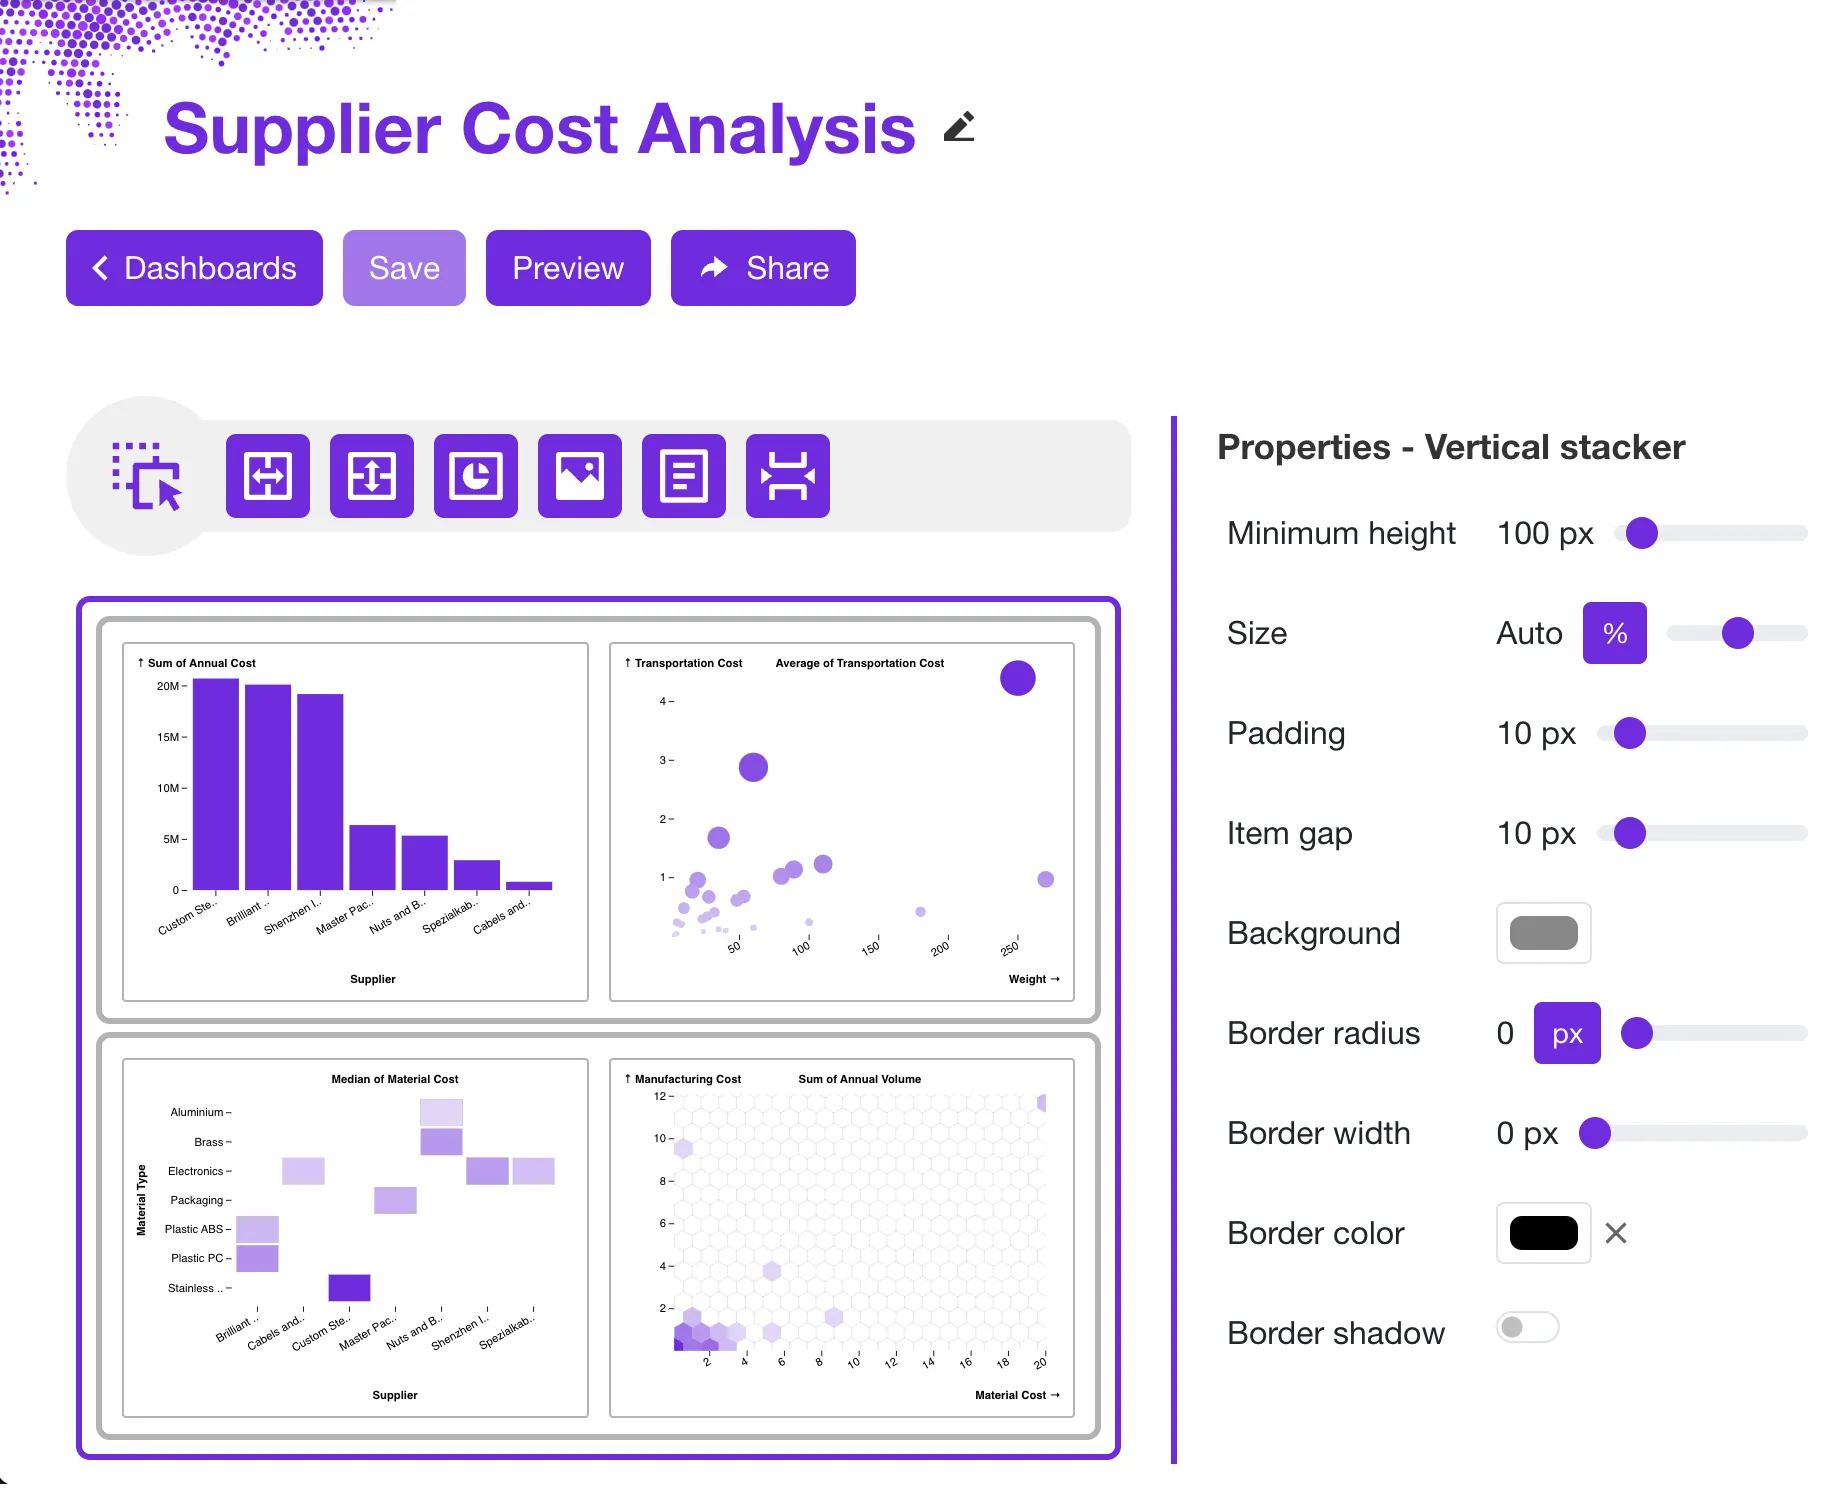
After creation, you can refine the result in the Sprucely.io editor like any other dashboard: rearrange the layout with drag and drop, apply one of the pre-defined color themes or your own palette, and reconfigure individual charts with the chart wizard.
Appending to a Dashboard Run After Run
The append capability is what turns a one-off chart into a living record — the “keep tracking this every week” pattern. Because a later conversation — or a scheduled Claude agent — can add rows to a dashboard created earlier, you can run a weekly pattern like this:
Week 1 - “Analyze this week’s pipeline export and create a Sprucely dashboard tracking totals by stage.” Claude creates the dashboard; you share the link once.
Every following week - “Analyze this week’s export and append the results to the pipeline dashboard.” Claude adds the new rows; the same link now shows the longer history.
If you use Claude’s scheduled agents, the weekly step runs without you: the agent performs the analysis and appends the fresh rows each run, and the dashboard’s audience keeps opening the same URL. The dashboard updates when — and only when — an agent run writes to it, so the cadence of your agent is the cadence of your report.
This pattern fits any recurring interactive report: weekly client reporting, sales pipeline reviews, support ticket trends, marketing campaign results, or operational KPIs. The analysis happens in Claude; the record accumulates in Sprucely.io.
Use Cases: AI Agents for Data Analysis
AI agents for data analysis need somewhere to deliver their results, and the same two building blocks — create a dashboard, then append to it run after run — cover most recurring reporting jobs. A few concrete patterns:
Living KPI ledger for a scheduled Claude agent. Ops and finance leads who already run a Claude Routine, Managed Agent, or Cowork task on a weekly cadence give that agent one more instruction: append the run’s numbers to a Sprucely dashboard instead of letting them die in the session. The dashboard becomes the canonical record of every run, and the Monday check-in is “open the link,” not “re-run the analysis.”
“Every Monday, pull last week’s revenue and pipeline numbers and append them to the Weekly KPIs dashboard.”
Client reporting for consultants, fractional CFOs, and small agencies. Instead of rebuilding a slide deck each month, ask Claude to create the client’s dashboard once and append fresh numbers on each engagement. Because the dashboard is a first-class Sprucely.io dashboard, sharing it — by link, by email, or embedded in a report — happens from your account whenever you decide the client should see the update; Claude does the analysis, not the sending.
“Analyze this month’s client data and append it to the Acme Corp reporting dashboard.”
Sales pipeline and deal reviews. Revenue teams track stage-by-stage pipeline totals over time by having Claude analyze a CRM export and append to a pipeline dashboard after each sync, turning a point-in-time snapshot into a trend the whole team can open.
“Analyze this week’s pipeline export and append the stage totals to the Pipeline Review dashboard.”
Support and operations trend tracking. Support and ops leads use the same pattern for ticket volume, response times, or SLA compliance — a running dashboard that grows with each export, without a spreadsheet to maintain by hand.
“Summarize this week’s support tickets by category and append the counts to the Support Trends dashboard.”
Marketing campaign performance. Marketers and agencies append campaign results after each reporting cycle — spend, conversions, and channel performance — so stakeholders see the campaign’s arc, not just the latest snapshot.
“Analyze this campaign’s performance data and append it to the Q3 Campaigns dashboard.”
What each of these has in common: the interactive dashboard and the append tool already exist and work today. Recurrence comes from your own cadence — a scheduled Claude agent, or simply asking again next week — not from anything Sprucely.io schedules on your behalf.
Sharing and Embedding Your Dashboard
Ask Claude to share the dashboard and it returns a view link you can send straight to a client or colleague. Anyone with the dashboard link can open it in a browser — no account required, no login, on any device. Viewers get the full interactive experience, including cross-filtering on multi-dimensional charts.
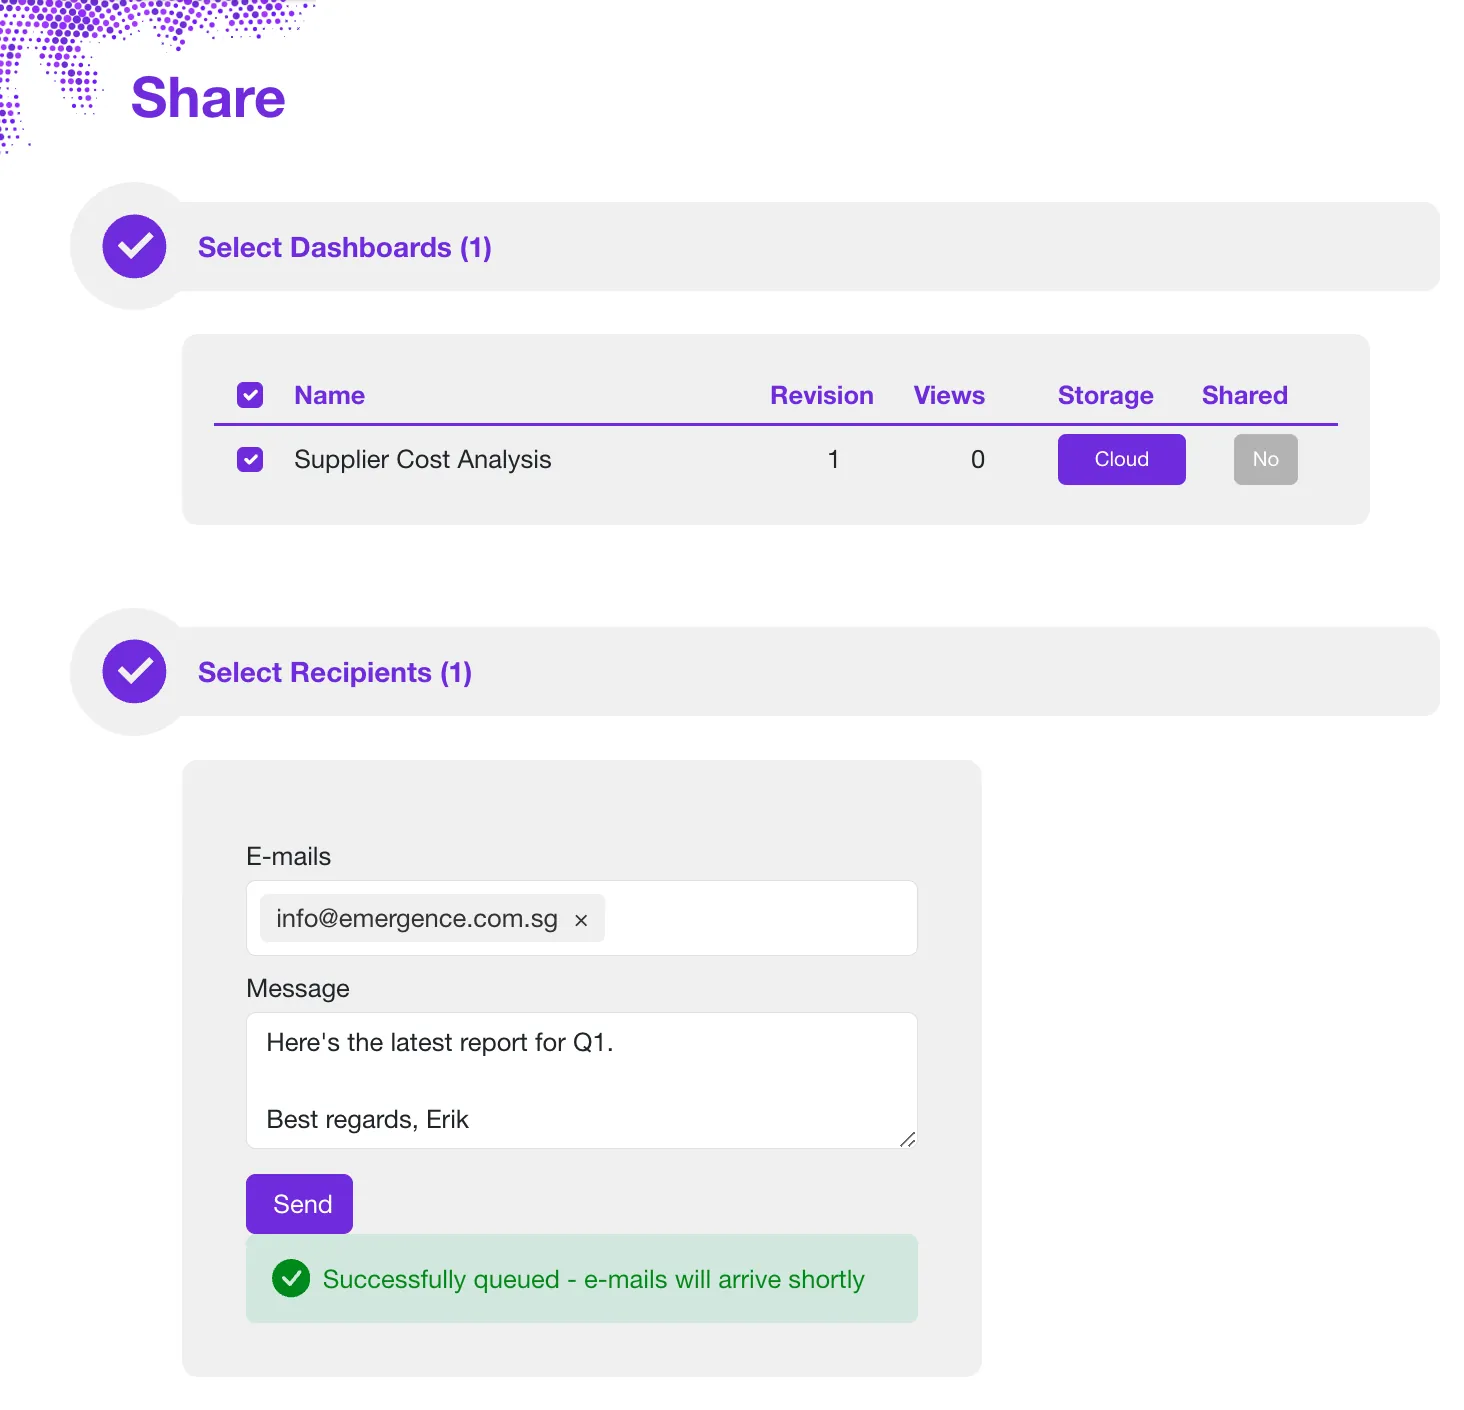
From your Sprucely.io account you can also send a dashboard by email directly to recipients, and switch sharing off again at any time. Step-by-step sharing instructions are in our Excel to dashboard how-to.
Beyond links, dashboards embed wherever your audience already works: in a customer-facing website via iframe, in PowerPoint presentations, and in Google Docs and Slides through the add-ons listed on our connectors page.
Plans and Limits
The connector works on every plan — there is no tier gate on the feature itself. The one thing that scales with your plan is dataset storage: it is metered against your plan’s quota, and the connector reports remaining space clearly if a dataset would exceed it. You can mint MCP API keys and sign in with your account on any plan, including free, with no limit on the number of keys. See pricing for current storage quotas and plan details.

Conclusion
Claude does the analysis; Sprucely.io turns it into a persistent interactive dashboard your clients and executives open from a link or an email — no Claude account, no login, and none of your Claude usage spent on viewers. Connect the two once, and an insight produced in a conversation becomes a dashboard you can send, embed, and keep growing.
Add the Sprucely.io connector in Claude’s settings with the endpoint https://www.sprucely.io/mcp, or from Claude Code with claude mcp add. Then ask Claude for your first dashboard, refine it in the editor if you like, and share the link.
If you prefer to build dashboards directly from your files, our guide to creating an interactive Excel dashboard covers the same result without Claude, and the PowerPoint dashboard how-to shows how to present the finished dashboard in your slides. For an overview of both routes — uploading a spreadsheet and describing what you want, or having an assistant build it here — see the AI dashboard generator.
Sign up for free with Sprucely.io to get started. You can also check out our getting started guide or compare subscription plans first.
This article was first published 28th July 2026.
About the Author

Erik Unemyr
Founder of Emergence Software and the Sprucely.io Platform Lead
Frequently Asked Questions
How do I connect Claude or Claude Code to the Sprucely.io MCP server?
In Claude (web or the desktop app), go to Settings, then Connectors, choose Add custom connector, and paste https://www.sprucely.io/mcp — or search for Sprucely.io in the public connectors directory and install it directly from there. Claude opens a Sprucely.io sign-in page where you sign in or create a free account. In Claude Code, run claude mcp add --transport http sprucely https://www.sprucely.io/mcp and authenticate when prompted.
What are Claude connectors?
Claude connectors are add-ons, listed in Claude’s public connectors directory or added by URL as a custom connector, that let Claude call an external service directly from a conversation. The Sprucely.io connector is one of them: once added, Claude can create, look up, and append to interactive dashboards without you leaving the chat.
What data can Claude access through connectors?
Only what the connector exposes. The Sprucely.io connector lets Claude create dashboards, read back the ones already in your account, and append rows to a dashboard’s dataset — it has no access to your files, email, or any other Claude connector’s data. Sprucely.io itself only stores what Claude sends it to build the dashboard.
How is a Sprucely.io dashboard different from a chart in the Claude conversation?
Persistence and reach. A chart in a conversation belongs to that conversation; a dashboard created through the MCP connector is hosted at a stable URL, persists across sessions, can be appended to by later runs, and opens for people with no Claude account — without consuming any of your Claude usage.
Do the people I share a dashboard with need a Claude or Sprucely.io account?
No. Anyone with the view link can open the interactive dashboard in a browser — no Claude account, no Sprucely.io login, no software install, on any device. You can also send the dashboard by email from your account, and switch sharing off again at any time.
Which chart types and dataset limits does the connector support?
Six chart types — bar, line, area, dot (scatter), cell (heatmap), and hexbin — with aggregation (sum, average, count, median, min, max, standard deviation) and time-based grouping for date columns. Dashboards can combine many charts and widgets, a dataset holds up to millions of records in paid subscription tiers, and a single call carries up to 50,000 rows; Claude appends larger datasets in follow-up calls automatically.
Can a dashboard update itself after it is created?
Not on its own. A dashboard Claude creates is fixed as of the moment it was created — it changes only when a later connector call appends new rows, which is exactly what a scheduled Claude agent can do run after run, keeping the same shared link up to date. Separately, Sprucely.io’s editor supports linking a dashboard to a URL that re-fetches on every view instead, but that is configured directly in the editor, not through Claude.
Does the MCP connector work on the free plan?
Yes. The connector works on every plan with no tier gate on the feature; only dataset storage is metered against your plan’s quota. You can sign in with your account or mint an unlimited number of MCP API keys on any plan, including free. See the pricing page for storage quotas.
Can Claude send the dashboard to my client automatically?
Not directly from Claude today. Claude creates and grows the dashboard; sending it — by link or by email — happens from your Sprucely.io account whenever you choose, so nothing goes to a client without you deciding first. This is the same pattern used for weekly client reporting, sales pipeline reviews, and other recurring use cases.
Can I use Claude as an AI agent for data analysis?
Yes — that is the pattern this connector is built for. Claude performs the data analysis in a conversation or a scheduled run, and Sprucely.io gives it a delivery tool: the analysis becomes a hosted interactive dashboard that human reviewers open from a link. Teams running several AI agents for data analysis can give each agent its own MCP API key, so every agent creates and appends to dashboards in the right account.
Is Sprucely.io one of the best MCP servers for Claude Code?
For workflows that need to hand results to someone outside the terminal, yes — it is one of the few MCP servers for Claude Code built specifically to turn output into a hosted, shareable dashboard rather than text in a session. Add it with claude mcp add --transport http sprucely https://www.sprucely.io/mcp.